Explore a collection of policy analysis, research papers, and case studies focused on systemic change and institutional reform.
August 2026
Research
Policy is Lived: Roots, Rights & Repair
Founder-led research and youth public learning rooted in reparations, local history, belonging, and community repair — developed with the YWCA White Plains & Central Westchester Y Leaders Group.
Policy is Lived · Founder-led research & public learning
Roots, Rights
& Repair
A youth-centered learning model that connects Westchester history, civil rights, belonging, and the practice of repair. Built from reparations research and teaching with the YWCA White Plains & Central Westchester Y Leaders Group.
YWCA White Plains & Central Westchester · Y Leaders
The learning experience is grounded in youth leadership, lived expertise, and civic learning. It does not publish student names, completed reflections, ages, or personal work.
Policy is lived begins with a simple premise: public policy is not distant from everyday life. It is experienced in homes, schools, neighborhoods, healthcare, work, movement, and the stories communities carry across generations. Roots, Rights & Repair translates this premise into a youth-centered practice of historical inquiry, civic learning, and repair.
“The world does not need more people who merely survive. It needs people who thrive — who move from isolation to community and join with others in building something better.”
The learning arc
Arc
Public question
Learning practice
Roots
What happened here?
Story maps, local history, a civil-rights timeline, and the interactive Westchester map.
Rights
What protections, precedents, and public responsibilities exist?
Civil-rights discussion, key-term learning, and documentation of repair precedents.
Repair
What could repair look like?
Repair-spectrum activities, creative reflection, public dialogue, and youth-led action.
Everyday Policy of Belonging
The Everyday Policy of Belonging frames belonging as both an individual and institutional condition. It asks how people develop the internal grounding to name their experience while public systems create the external conditions for dignity, safety, participation, and opportunity. In this framing, lived expertise, cultural wealth, coalition-building, and practical policy learning are forms of research evidence.
For Y Leaders, reflection becomes public practice: students trace roots, study policies that shaped local inequity, name what they would repair, and imagine a more equitable Westchester. The public hub offers blank learning materials and facilitation resources; completed student work remains private.
People-centered map record
The people who were enslaved here
Westchester’s history of slavery must not be reduced to estate names or map points. The record below restores documented names, counts, and enslaver households from surviving inventories, wills, manumissions, and censuses. Many archives omit names; where that happens, the absence is named plainly rather than filled with guesses. Open the Roots, Rights & Repair map ↗
Philipsburg Manor — 23 people in the 1750 inventory
The 1750 inventory names Caesar, Sampson, Kaiser, Abigal, Massy, Dina, Venture, Sam, Betty, and others among 23 enslaved people. Enslaver household: the Philipse family and Philipsburg Manor. Read the inventory ↗
Philipse Manor Hall — names in censuses and wills
The 1698 census records 20 enslaved people. A 1702 will names Harry, Peter, and Wan, and a 1751 will preserves a longer list. Enslaver household: the Philipse family. Read the site record ↗
Van Cortlandt Manor — nine names documented
Historic Hudson Valley research documents Titus, Bridget, Ishmael, Sib, Abby, Phillis, Jin, Sair, and Dine. Enslaver household: the Van Cortlandt family. Read the record ↗
Jay Estate, Rye — up to nine people documented
Records name Old Mary, Zilpha, Plato, Peter, Hannah, Dinah, Caesar, Sylvia, and Pete across the Jay family’s Rye estate history. Enslaver household: the Jay family. The record supports up to nine people at the estate—not an unsupported count of 130. Read the estate history ↗
John Jay Homestead — household counts and names
Surviving records document 5 people in 1790 and 1800, 6 in 1798, and 1 in 1810; names in related records include Peet, Claas, Benoit, Abigail, and Plato. Enslaver household: the Jay family. Read the source framing ↗
Pelham Manor — a town count, not one household
The 1790 census records 38 enslaved people across 11 Pelham households. Historic research connects enslaved labor to Pell and Bartow family properties; individual names require source-by-source confirmation before being assigned to this map point. Read the research note ↗
Aunt Betty is documented in local remembrance. The number and identities of people buried at this site are not known in surviving records. Editorial note: uncertainty belongs in the public record. Read the memorial history ↗
Morrisania Estate — census counts across time
Censuses record 26 enslaved people in 1712, 29 in 1755, and 17 in the household of Lewis Morris in 1790. Individual names are not reliably preserved for this marker. Enslaver household: the Morris family. Read the regional record ↗
Scarsdale — counts and a borderland family record
Records show 8 enslaved people in Scarsdale in 1712 and 48 across Scarsdale and Mamaroneck in 1755. A nearby Mamaroneck–Scarsdale record names Rose and her children Amos, Lazerus, Dennes, Jacob, and Elenor, enslaved by Thomas Haden. These names are presented as a borderland record, not assigned to a specific Scarsdale estate. Read the regional record ↗
New Rochelle — census counts and Hannah Pugsley
Town records document 43 enslaved people in 1698, 31 in 1755, and 28 in 1790. The 1799 manumission of Hannah Pugsley preserves a rare individual name. Enslaver household: the Quaker household of Hannah Pugsley in the manumission record. Read New Rochelle town records ↗
How to read this record: counts describe specific censuses or households, not a total number of people enslaved across all time. Names follow surviving records and may contain historical spellings. This is a living research record, not a complete accounting.
Founder work with WWA
From conversation to local research
Policy is Lived grew from founder-led work with Westchester Women’s Agenda and the Juneteenth Committee created to spark sustained conversations and research about slavery in Westchester and the need for reparations. This work convenes public learning across history, law, community memory, and practical questions of repair.
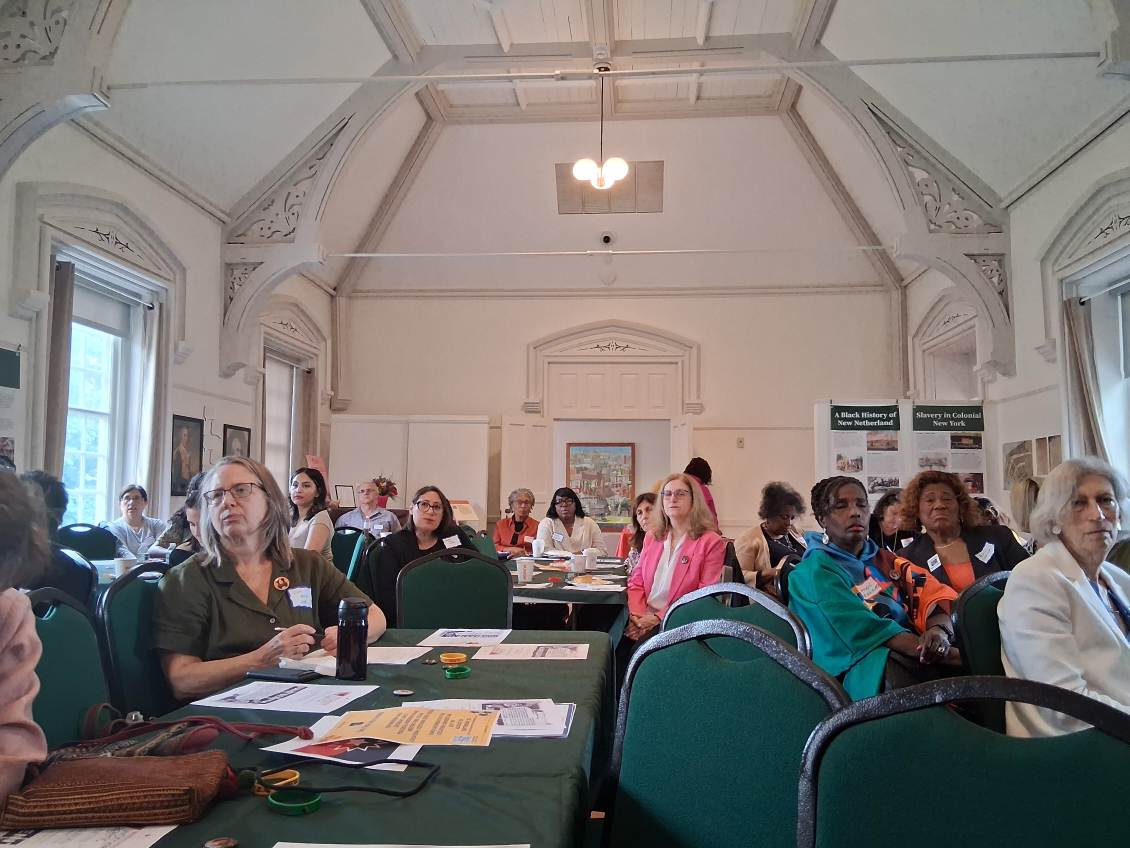
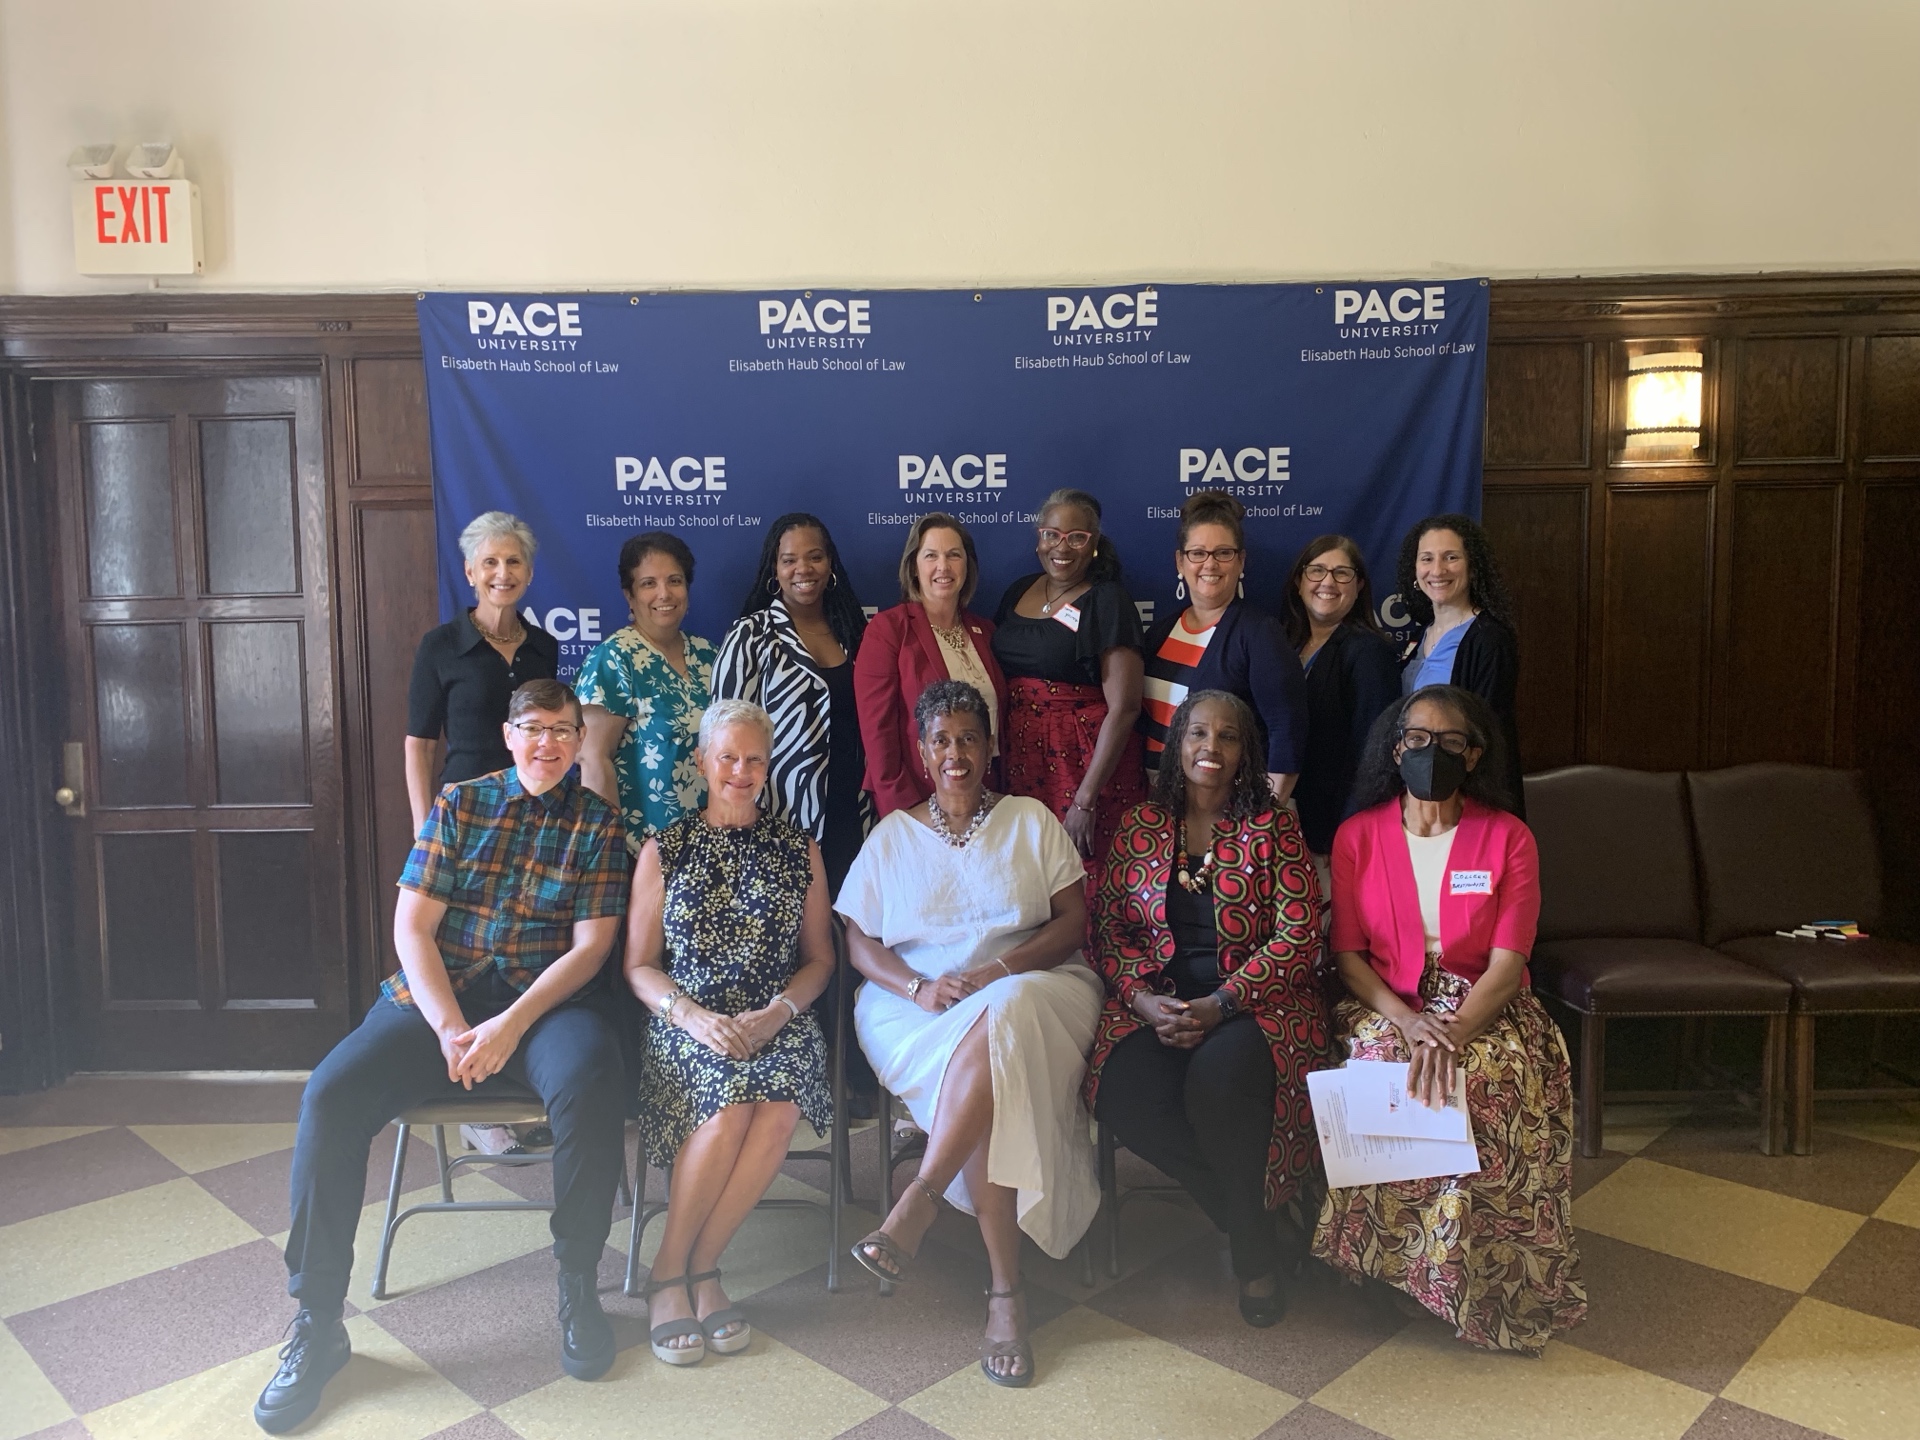
The gatherings documented below reflect a public-learning practice: listening across generations, connecting local history to present-day institutions, and making room for community-led research, dialogue, and accountability.
Public-learning gathering connecting local history, community memory, and repair conversations.WWA Reparations Remedies Public Policy Workgroup participants advancing shared study and public-policy dialogue.
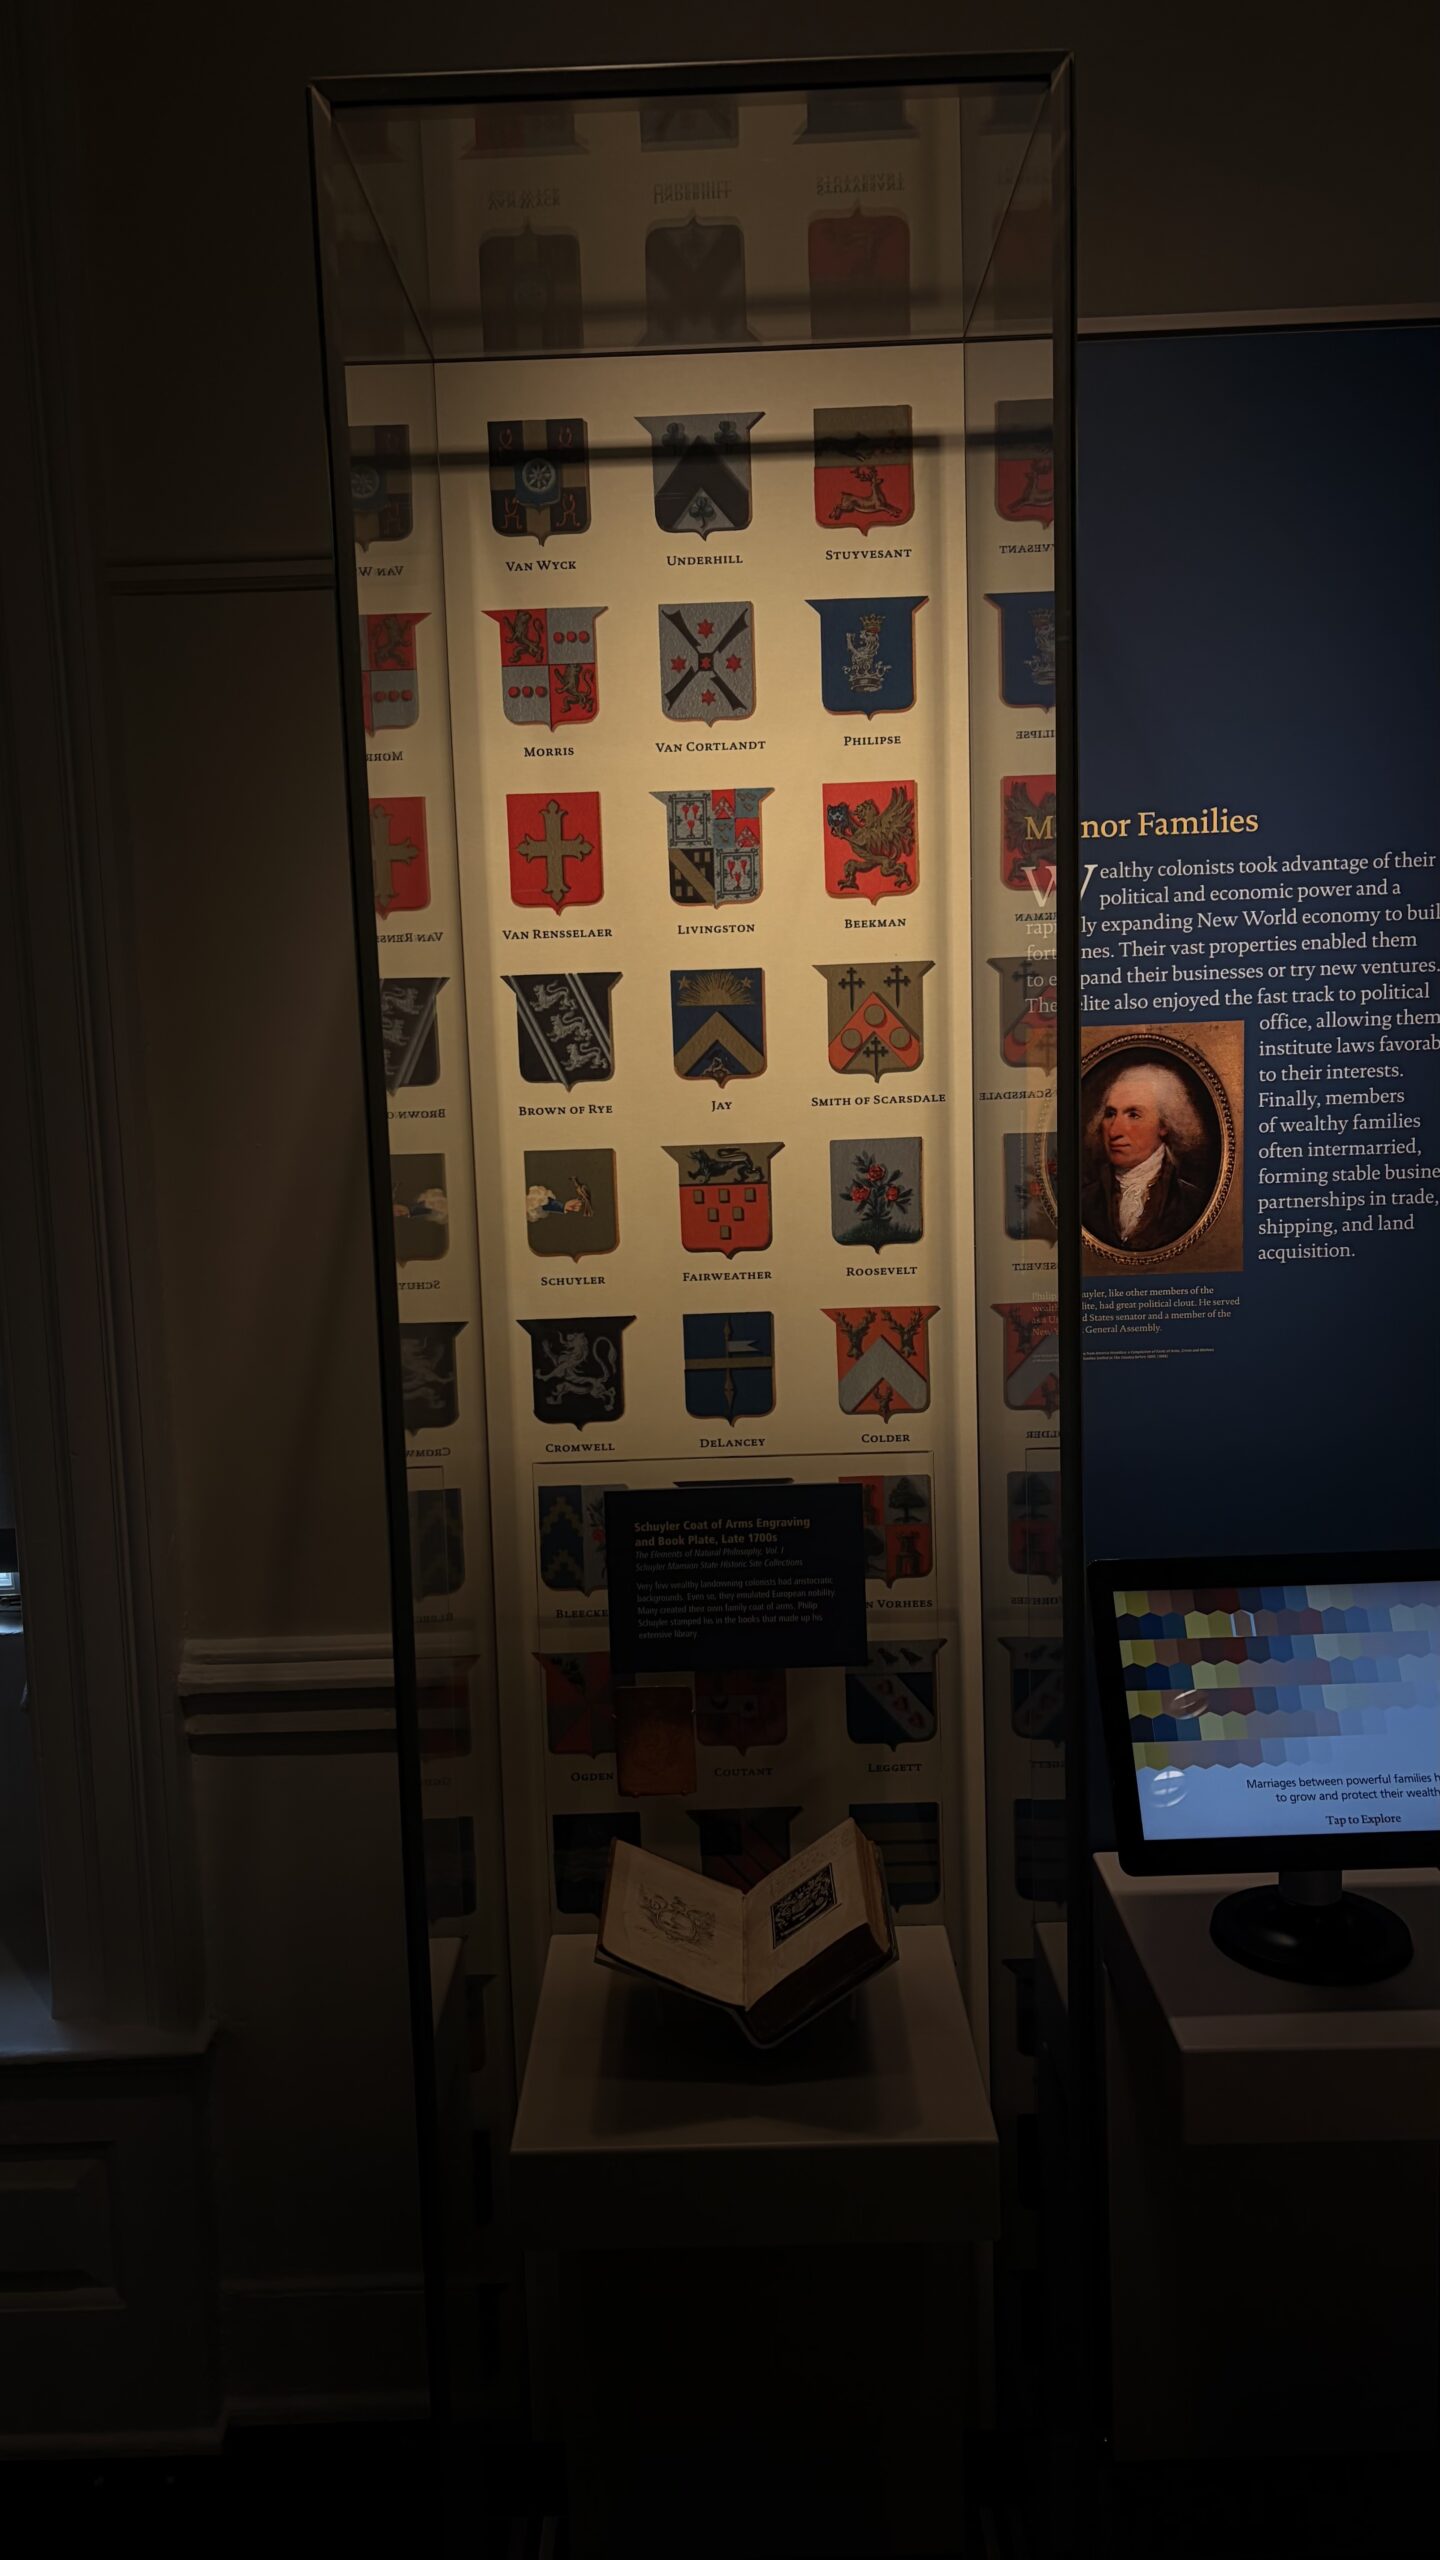
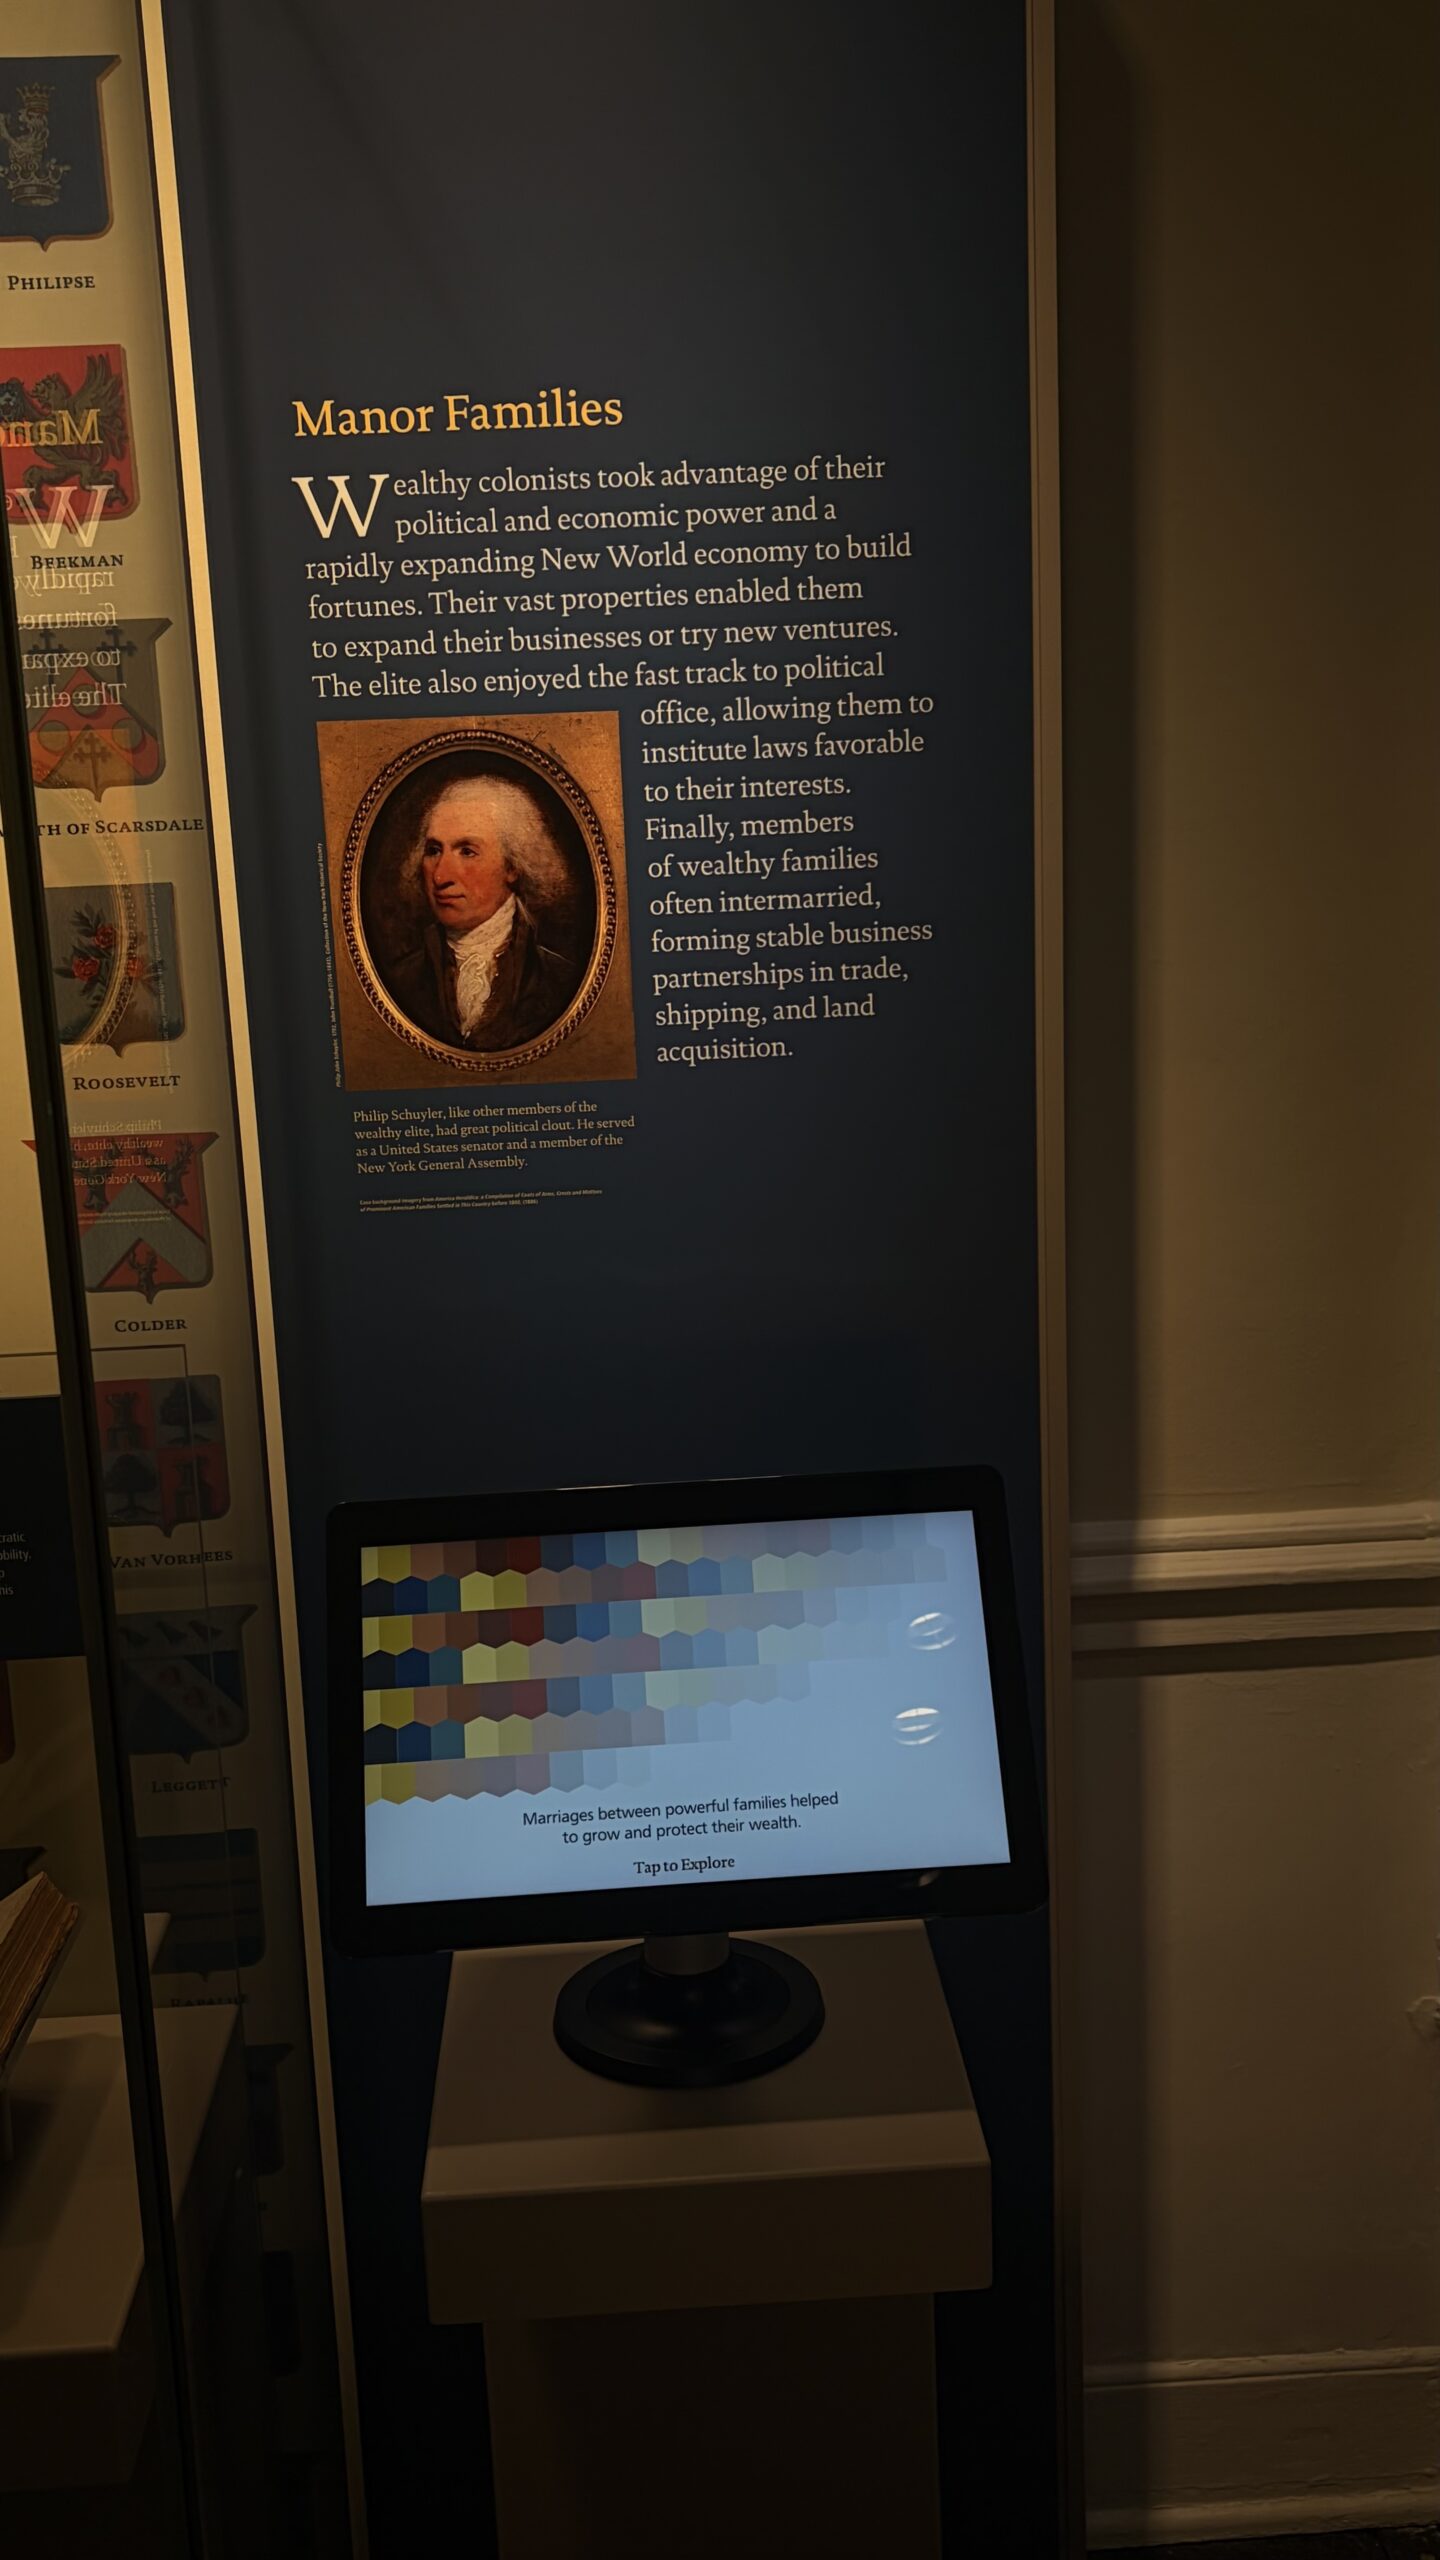
Museum exhibit panel titled Manor Families.Gallery view of exhibit materials and an interactive display.
Watch exhibit documentation: seven short clips
Research partnership
Westchester Women’s Agenda Reparations Remedies Public Policy Workgroup
This work is connected to the WWA Juneteenth Committee’s A Timeline of Enslavement, Law & Resistance, a research resource that traces national, New York, and Westchester history as a basis for archiving, storytelling, and advocacy.
Source framing: WJCS Belonging Panel Talking Points; Roots, Rights & Repair Student Handout Packet; Westchester Women’s Agenda, A Timeline of Enslavement, Law & Resistance. This feature is public education and research framing, not legal advice or a complete historical record.
August 2026
Research
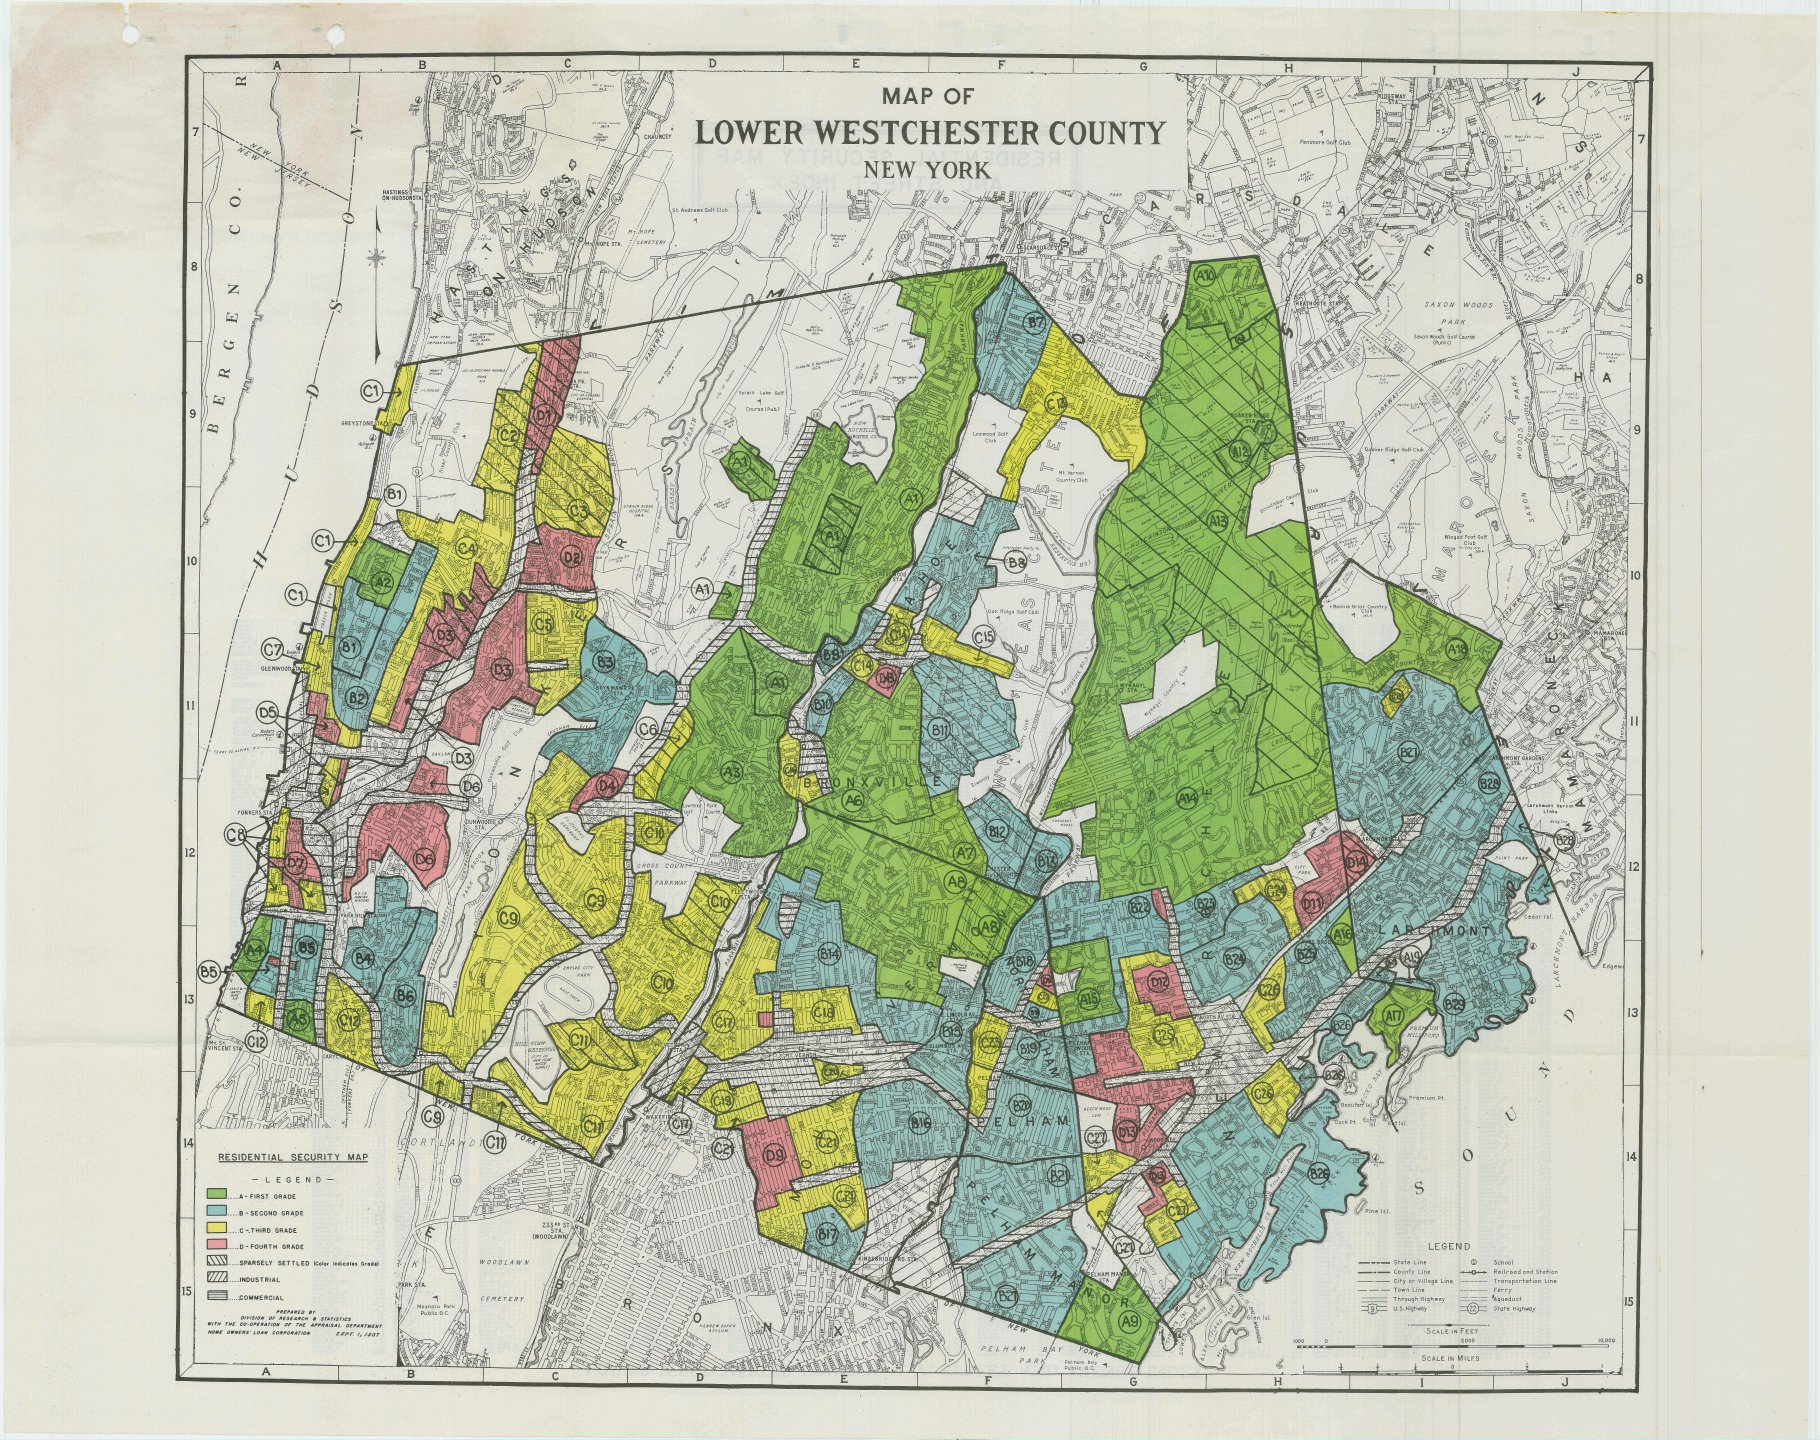
Redlining in Lower Westchester
An archival-scale visual reference for research on redlining in Lower Westchester. The supplied map is identified as a 1930s redlining map and is preserved here for examination alongside broader research into housing policy, neighborhood classification, and institutional inequity. The original image is displayed without editorial alteration.
An archival-scale visual reference for research on redlining in Lower Westchester. The supplied map is identified as a 1930s redlining map and is preserved here for examination alongside broader research into housing policy, neighborhood classification, and institutional inequity. The original image is displayed without editorial alteration.
Medicaid as Local Infrastructure: Enrollment, Financing, and Policy Exposure in Westchester and Rockland Counties
A source-validated analysis of 369,076 Medicaid enrollees in Westchester and Rockland Counties, the federal–state financing structure, and why national policy shifts carry local consequences.
Authored by The Good Policy Institute Expert Paper · August 2026
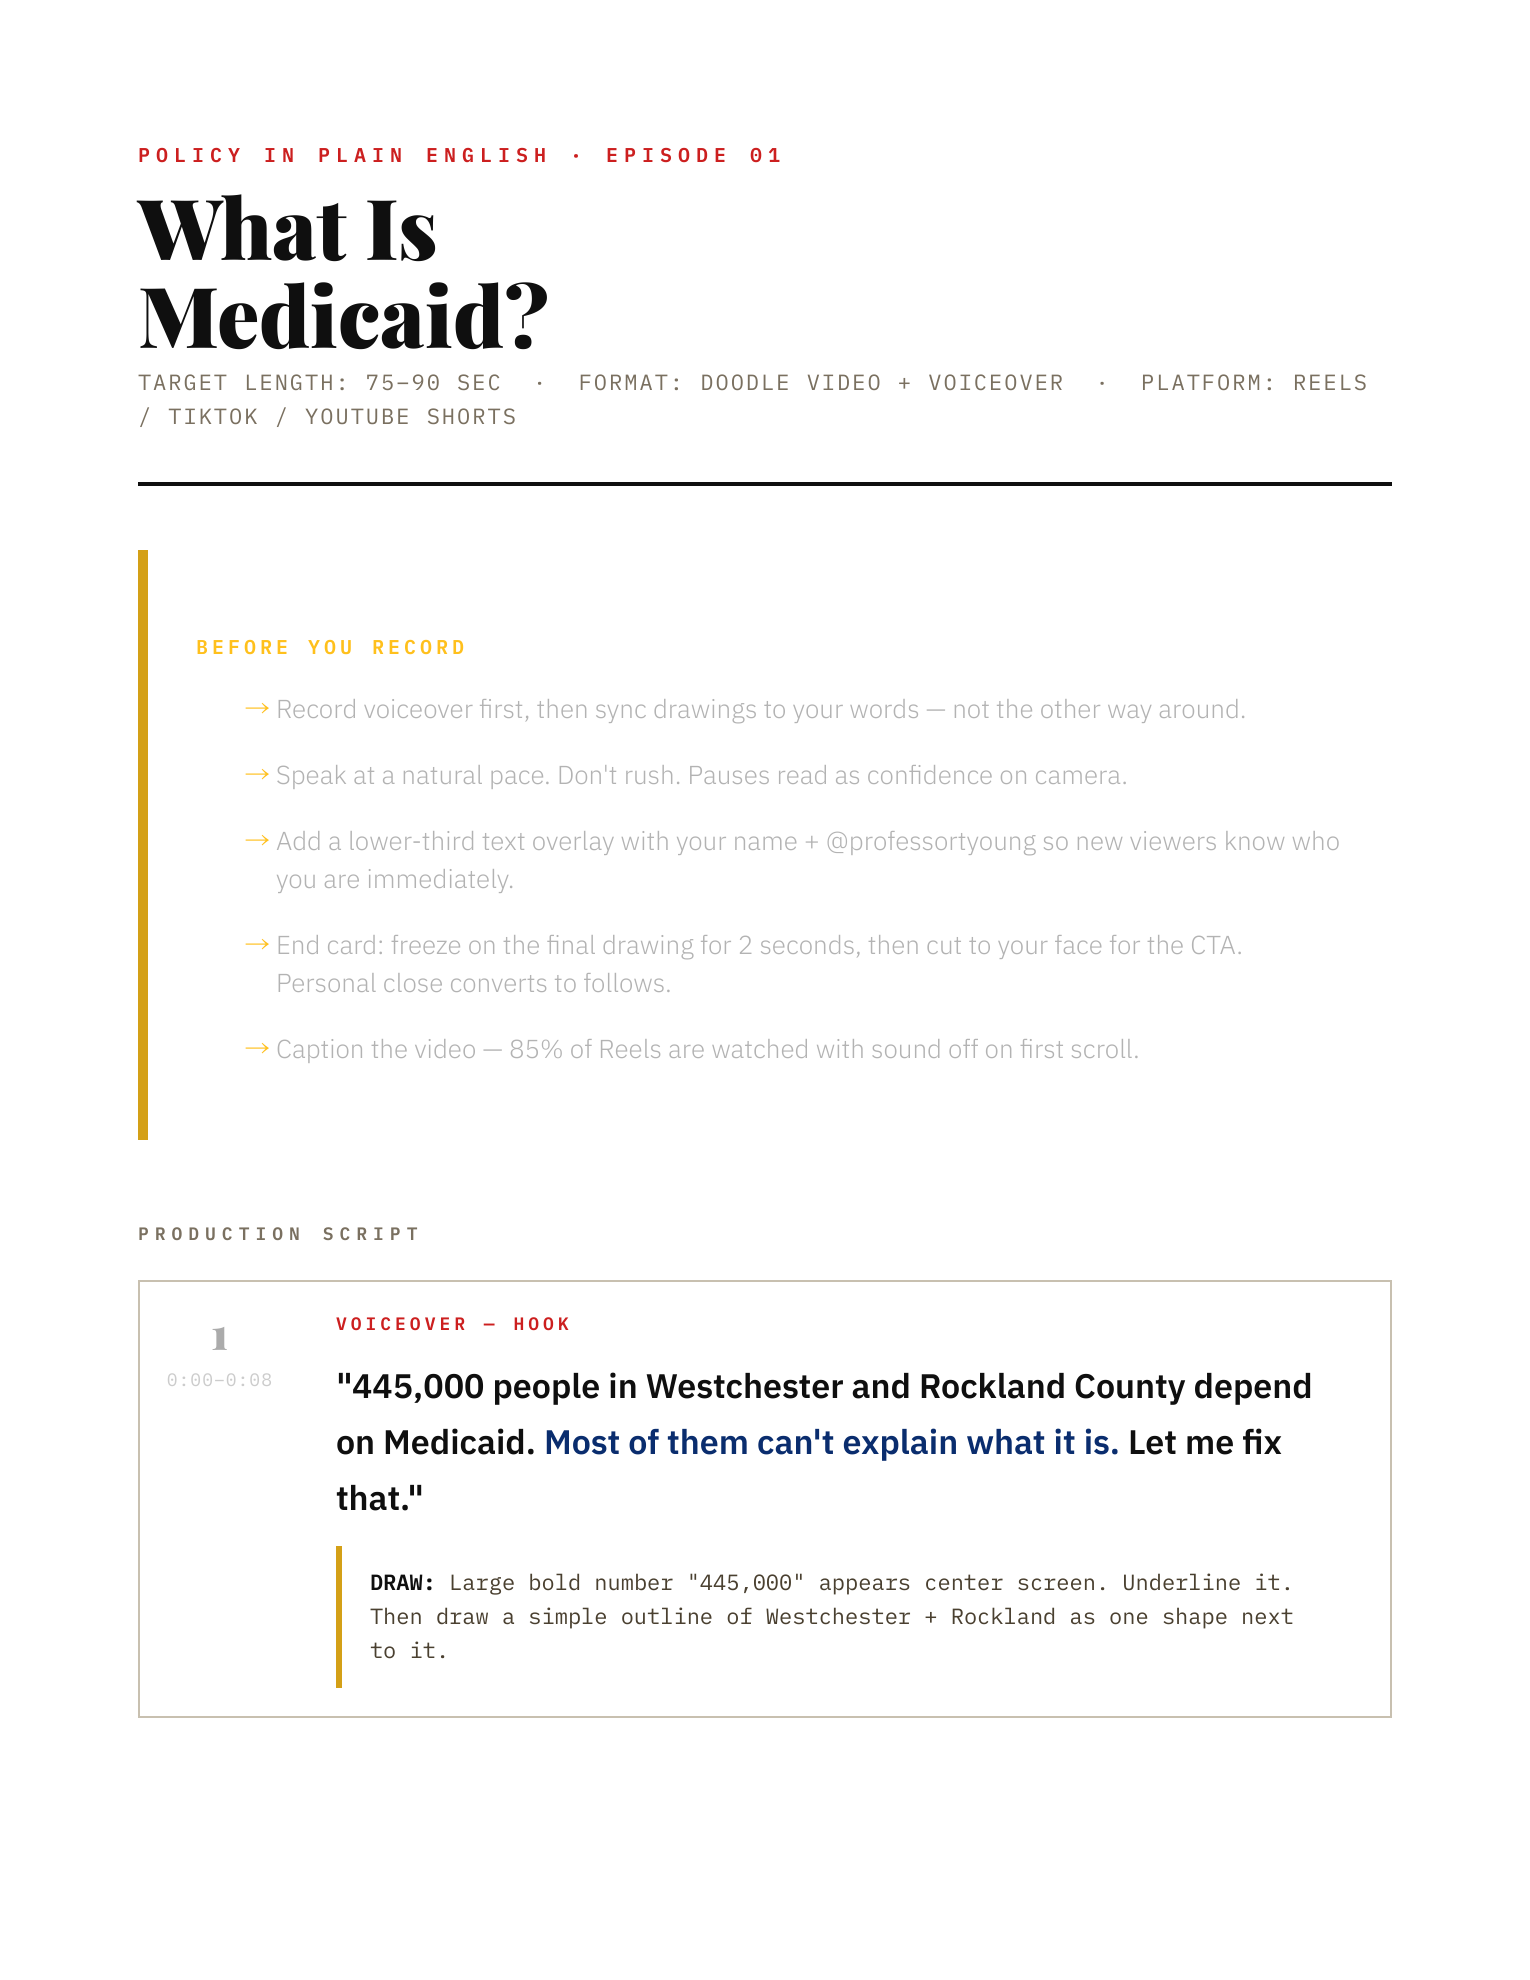
Abstract. Medicaid is often discussed as a distant public-benefit program, but county enrollment data show that it is a central element of health and economic infrastructure in the lower Hudson Valley. New York State reported 218,960 Medicaid enrollees in Westchester County and 150,116 in Rockland County in May 2026—369,076 people combined.1 This paper explains what that local reliance means, how Medicaid is financed, and why federal policy shifts can move risk to states, providers, families, and communities. It adapts the public-education premise of GPI’s Policy in Plain English Episode 1 script into a source-validated research brief.
Key Findings
Finding
Why it matters locally
369,076 people were enrolled in Medicaid across Westchester and Rockland Counties in May 2026.1
Medicaid is a core coverage system for a substantial share of households across the two counties.
Medicaid is jointly financed by the federal government and states.2
Changes in federal policy can affect New York’s fiscal choices, provider payments, and the administration of covered services.
Medicaid is the nation’s largest payer for mental-health services.3
Coverage policy has implications beyond acute medical care, including behavioral-health access and continuity of care.
CBO estimated that the Medicaid provisions in Title IV of the House-passed H.R. 1 would increase the number of uninsured people by 7.8 million in 2034 relative to current-law baseline projections.4
National budget choices can create local planning risk, even when a county-specific impact estimate is not yet available.
Medicaid Is a Local System, Not an Abstraction
Medicaid is commonly described as insurance for people with low incomes. That shorthand is incomplete. In practice, it is a large-scale coverage and financing system that connects residents to healthcare services while supporting the payment structures on which providers rely. The program is jointly funded by the federal government and the states. The federal government contributes a specified share of eligible program expenditures through the Federal Medical Assistance Percentage, while each state must finance its own share under its Medicaid plan.2
For Westchester and Rockland Counties, the scale is concrete. New York State’s May 2026 county enrollment databook reports 218,960 enrollees in Westchester and 150,116 in Rockland, for a combined total of 369,076.1 These figures are administrative enrollment counts rather than a measure of service use, health status, or household need. Even so, they establish a clear point: Medicaid is embedded in the everyday health security of hundreds of thousands of people in the region.
Coverage Includes More Than a Doctor’s Visit
State Medicaid programs operate within federal requirements and may cover services through fee-for-service and managed-care arrangements.2 The policy significance extends beyond primary and hospital care. Medicaid is the single largest payer for mental-health services in the United States and plays a major role in financing substance-use-disorder services.3
This breadth is especially important when analyzing policy effects through an equity lens. Behavioral-health access, long-term services and supports, and care coordination often determine whether people can maintain stability at home, remain connected to work or school, and avoid preventable crises. A robust local analysis should therefore avoid reducing Medicaid to a single category of medical benefit. It is better understood as a network of coverage, providers, financing arrangements, and public systems that touch many stages of life.
Federal Policy Changes Can Reallocate Risk
Because Medicaid financing is shared across levels of government, federal policy changes can shift budgetary and administrative pressure to states. The Centers for Medicare & Medicaid Services explains that states are responsible for their share of expenditures under their state plans, even as the federal government contributes its designated percentage.2 This structure means that a reduction in federal support, a change in eligibility policy, or new administrative requirements can trigger decisions elsewhere in the system: state budgets, provider payment policy, enrollment operations, and local access to services.
The potential scale of federal changes is illustrated by the Congressional Budget Office’s June 2025 analysis of Medicaid provisions in Title IV of the House-passed H.R. 1. CBO estimated that those provisions would increase the number of people without health insurance by 7.8 million in 2034 relative to its current-law baseline.4 That is a national projection, not a county forecast, and it should not be converted into a Westchester or Rockland estimate without an appropriate methodology. Its local relevance is directional: communities with high Medicaid enrollment have a strong interest in how federal financing, eligibility, and administrative policy evolve.
Policy Implications for Westchester and Rockland
The local evidence supports three practical priorities. First, public institutions and community organizations should communicate Medicaid changes in plain language. Enrollment figures show the audience is not marginal; it is hundreds of thousands of local residents. Second, policymakers should evaluate proposed changes across the full coverage system, including behavioral health and continuity of care, rather than focusing only on headline budget figures. Third, local advocates should request transparent state-level impact assessments when federal changes are proposed, because the availability of county-specific enrollment data does not automatically reveal service, fiscal, or employment effects.
The Everyday Policy Project and THE HONEST SERIES offer one model for this work: connect policy mechanics to lived experience, distinguish verified evidence from advocacy claims, and make clear what information communities still need. Public understanding is not separate from policy capacity. It is part of the infrastructure that allows residents to participate in decisions that affect their care and their communities.
Method and Limitations
This paper combines a user-supplied GPI production script with publicly available New York State, federal, and congressional sources. The script shaped the paper’s explanatory focus but was not used as an evidentiary source for numerical claims. The paper uses New York State’s May 2026 enrollment figures for current county counts. It does not repeat the script’s unverified 445,000 regional enrollment figure, Rockland child-coverage percentage, facility counts, employment estimate, or a specific statewide spending-cut figure because those claims require additional primary-source validation before they can be presented as facts.